This page is used for experiments, eventually it shall replace the old NTP page.
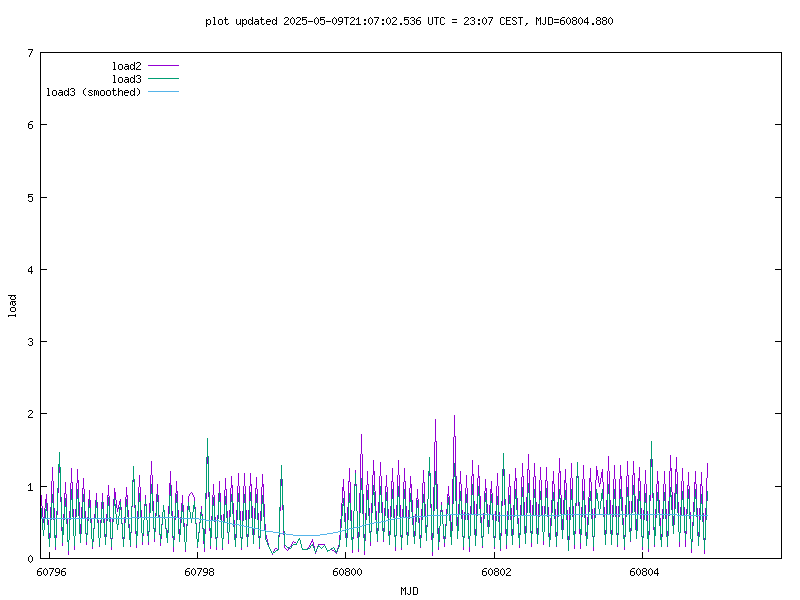
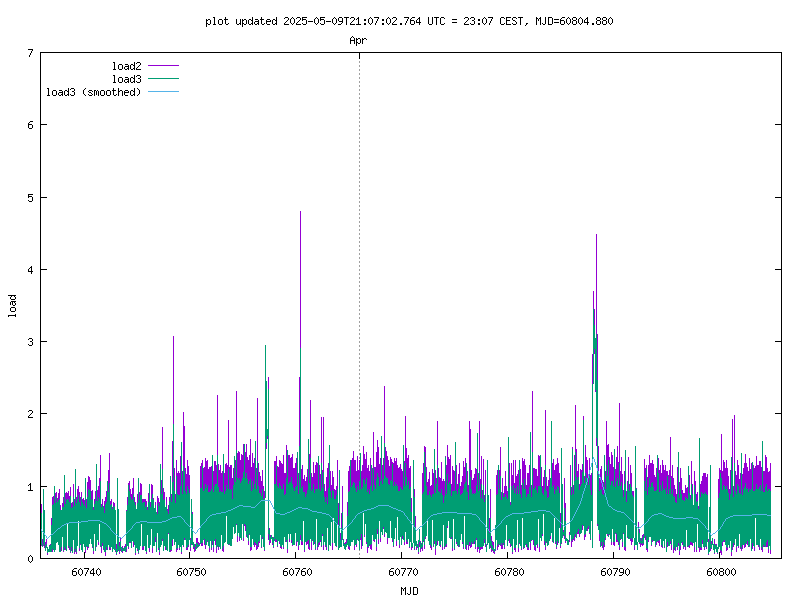
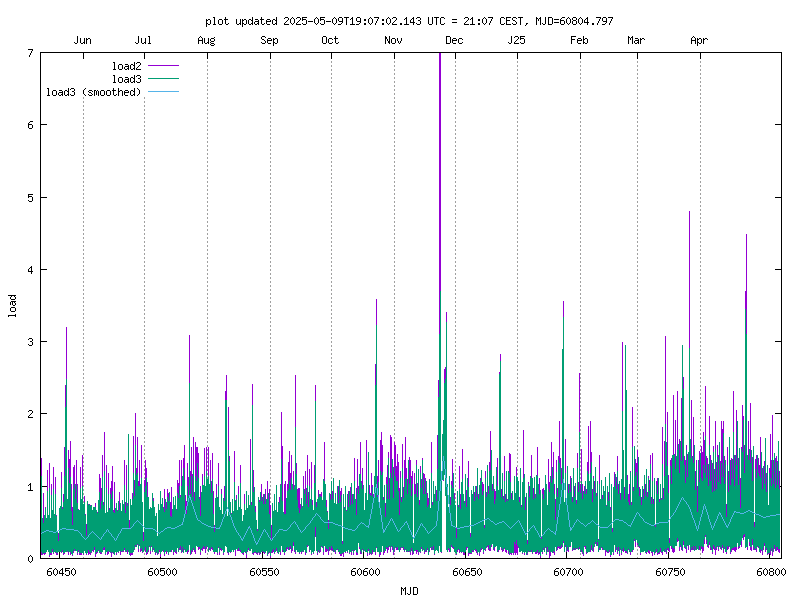
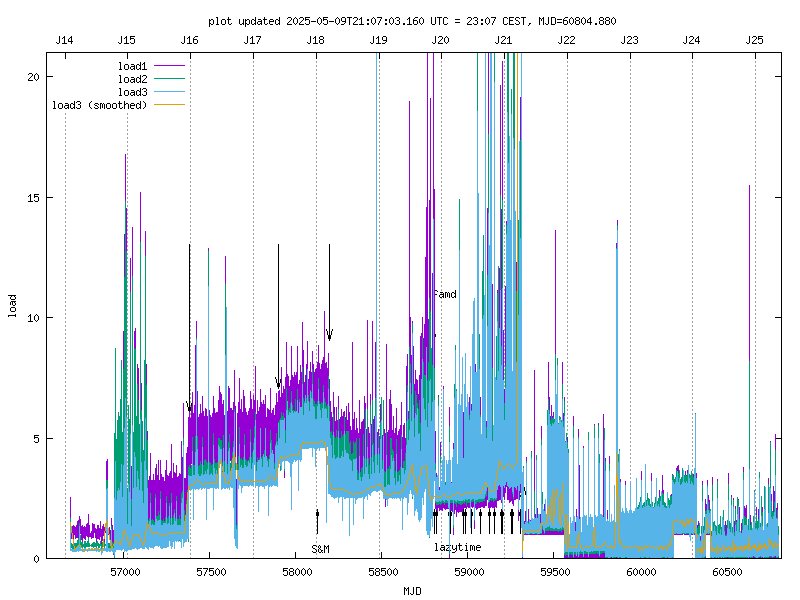
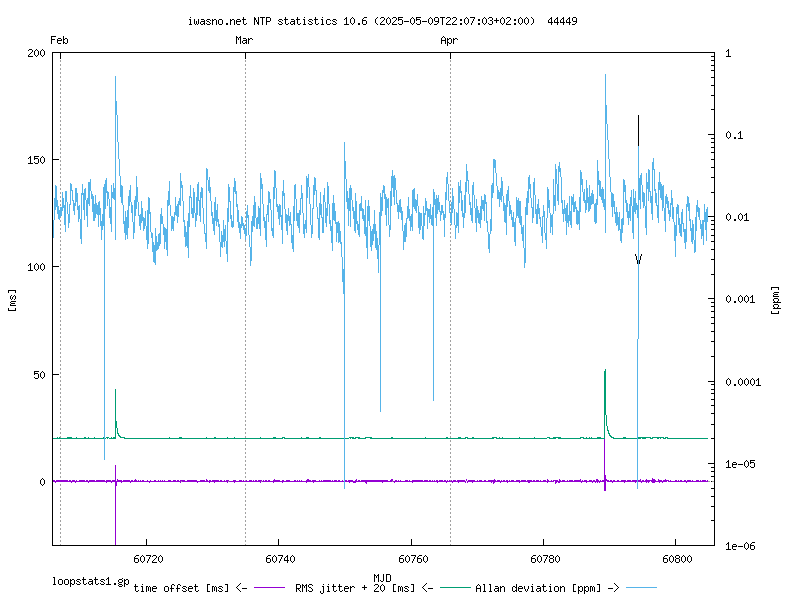
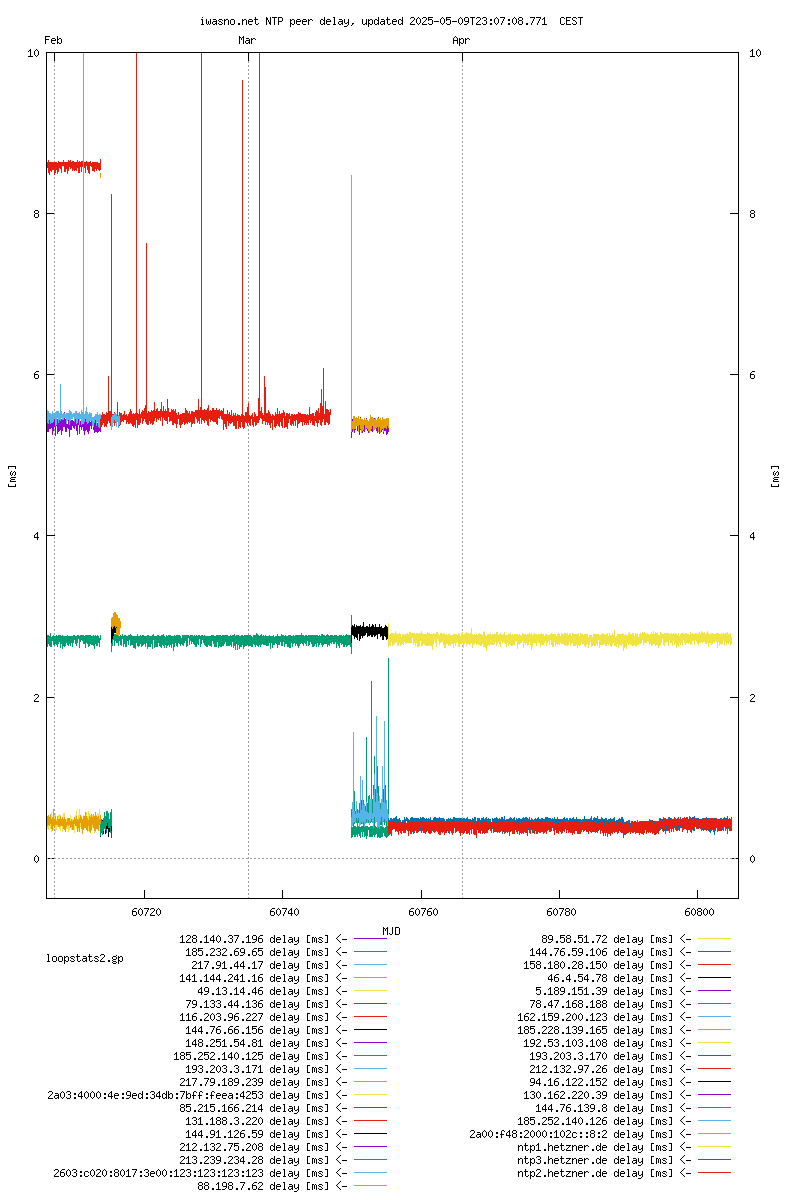
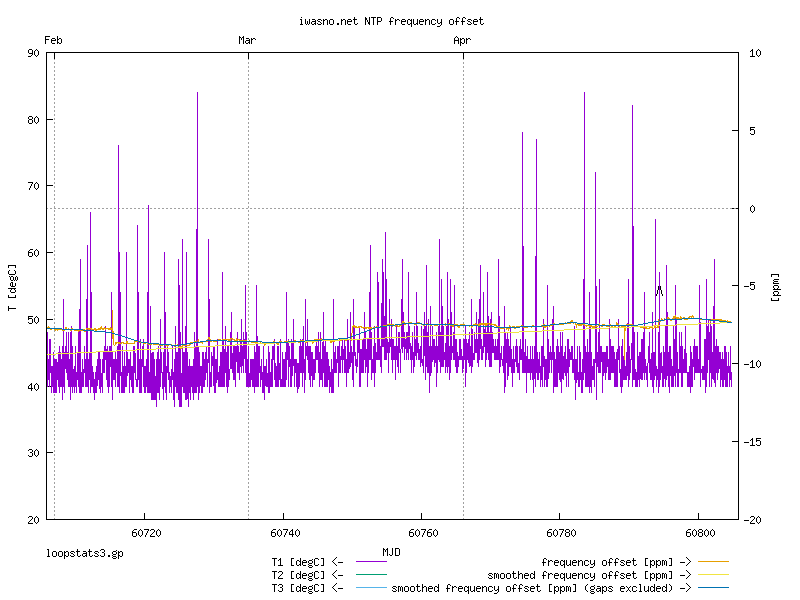
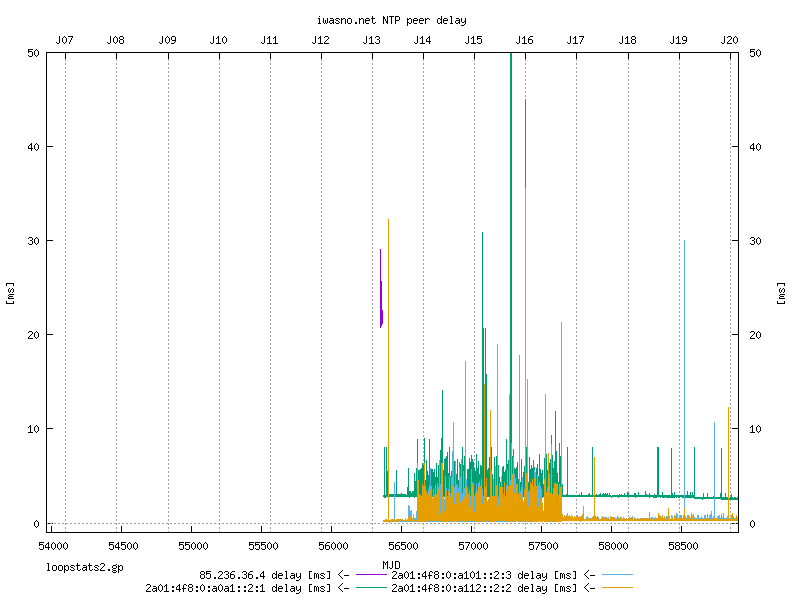
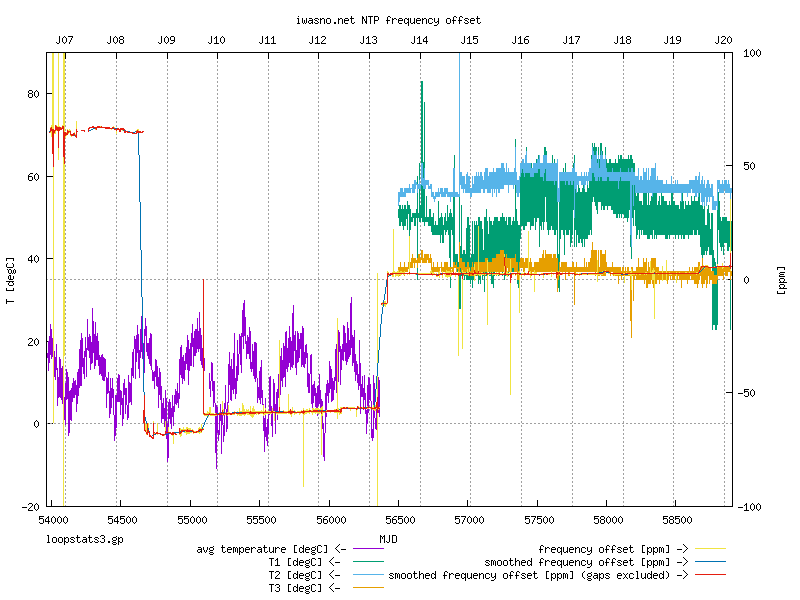
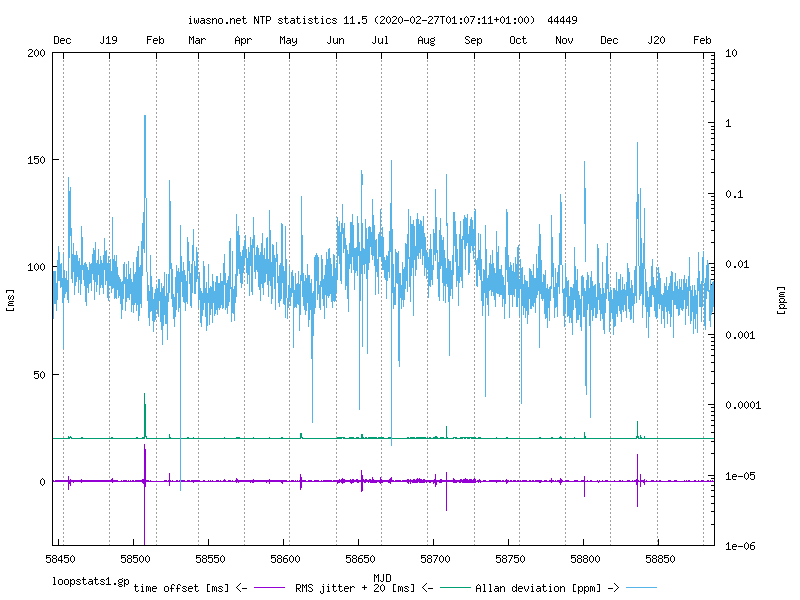
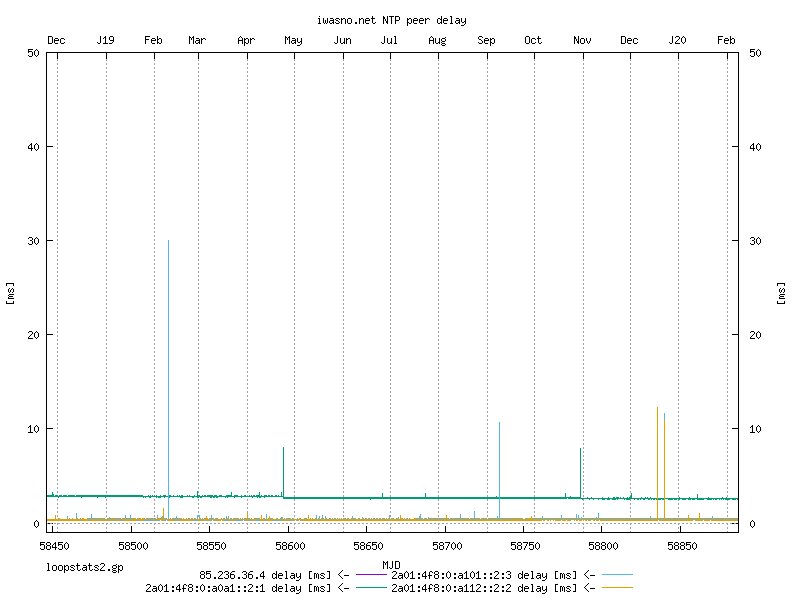
We have started to run the network time protocol daemon ntpd some time ago, here are the daily plots of the statistics. It seems that the time offset stays in the interval [-10 10] ms, but there are some disturbances which are probably due to congestion on the link between iwasno.net and the NTP peer.
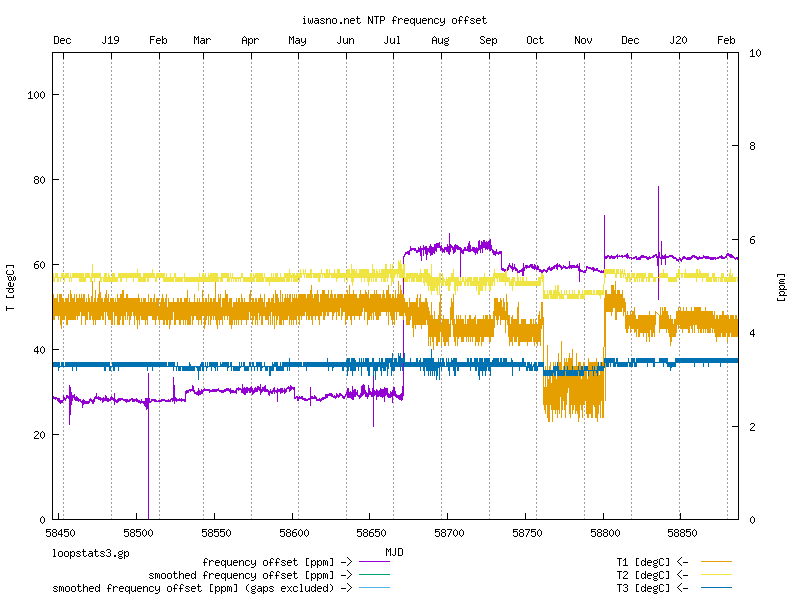
The following plot has been created locally using a gnuplot with PNG support (hence the nicer text font, I also increased the size to 800x600). Note that delay, jitter and offset values outside [-50 150] ms are not plotted to reduce the overlap between the curves.
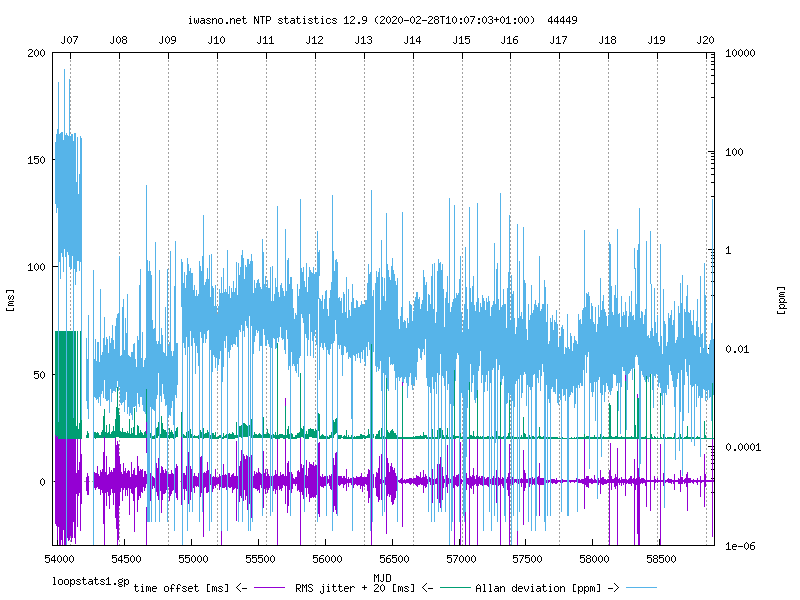
The NTP peers before 2013 have to be added to this plot.
Some information about peers used in the first few months can be found on the NTP peers page.
Last changed: 2024-05-19T09:24:24-CEST.
![]()
 back to Roland's start page.