NTP statistics for iwasno.net

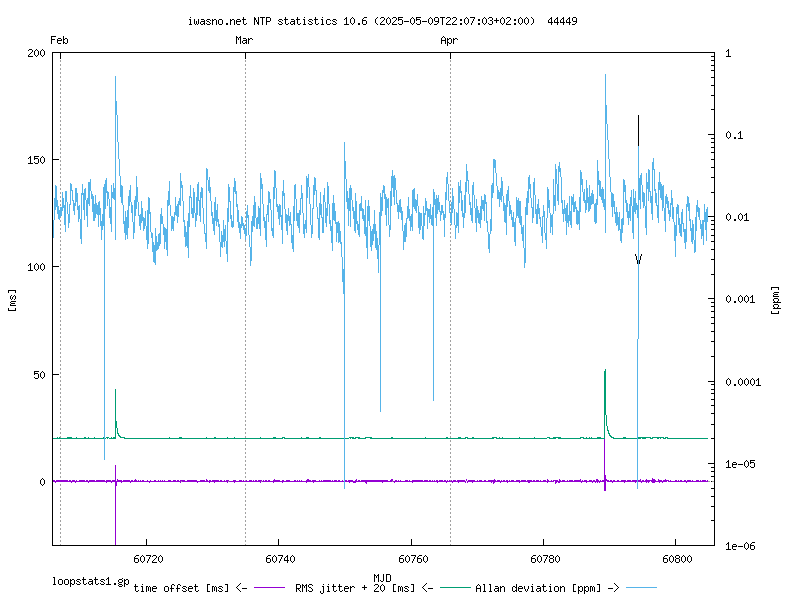
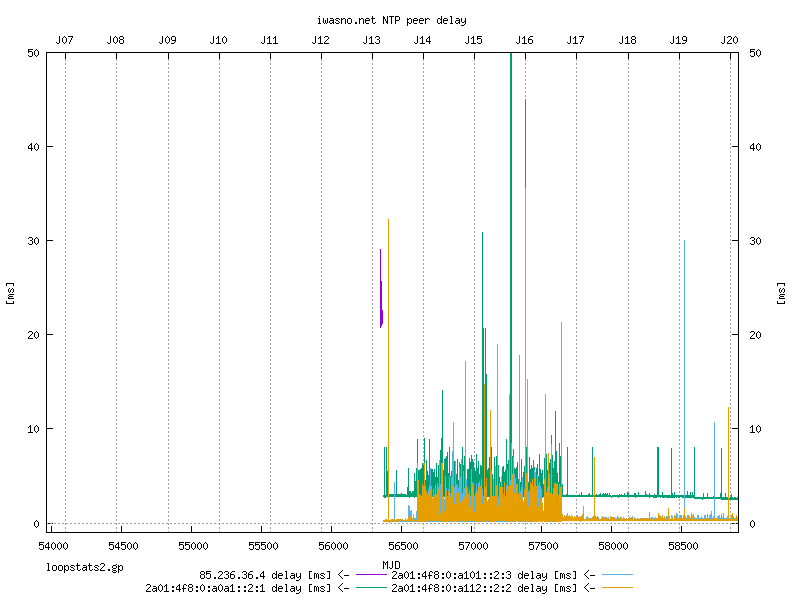
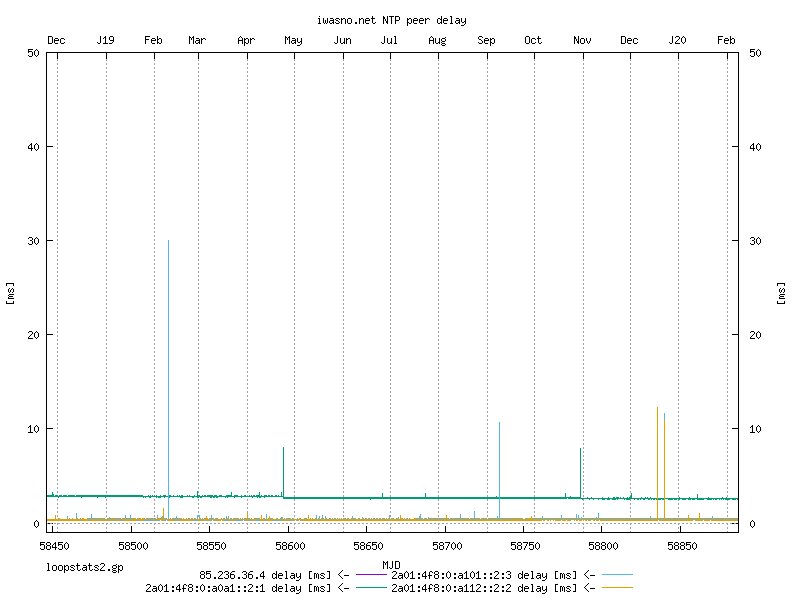
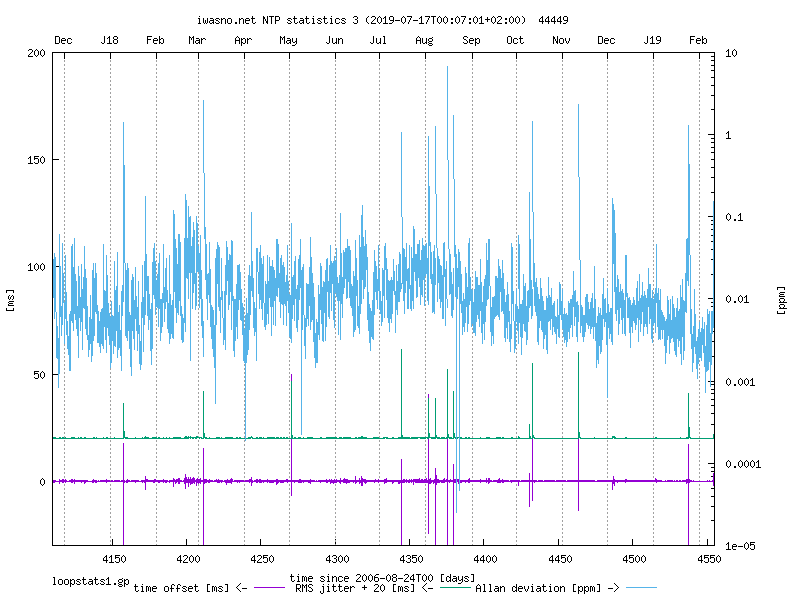
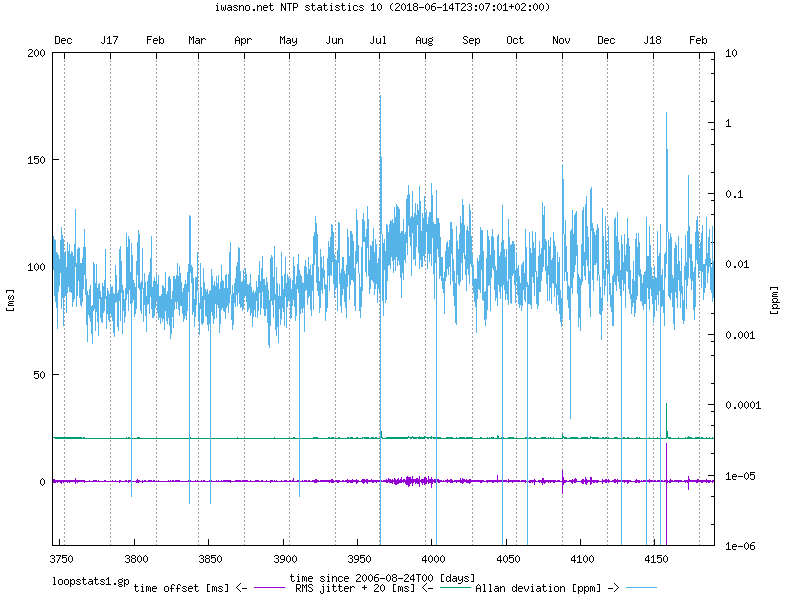
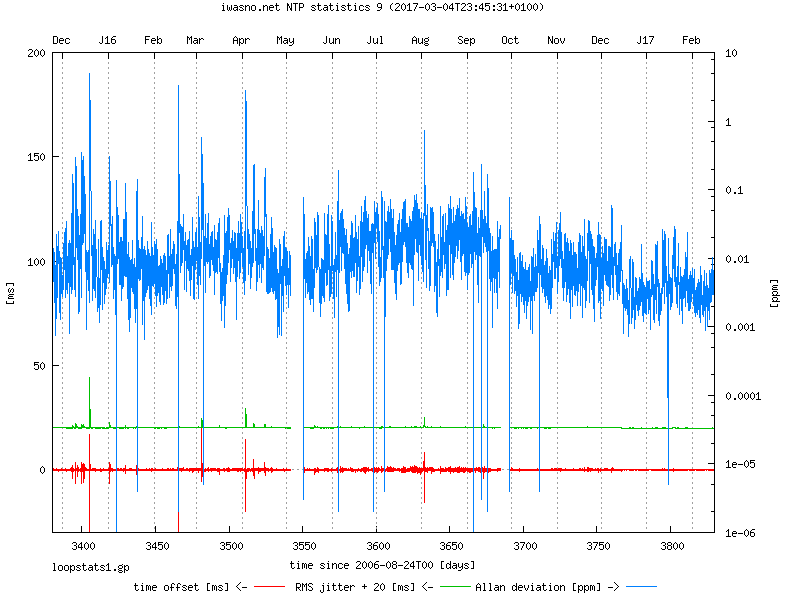
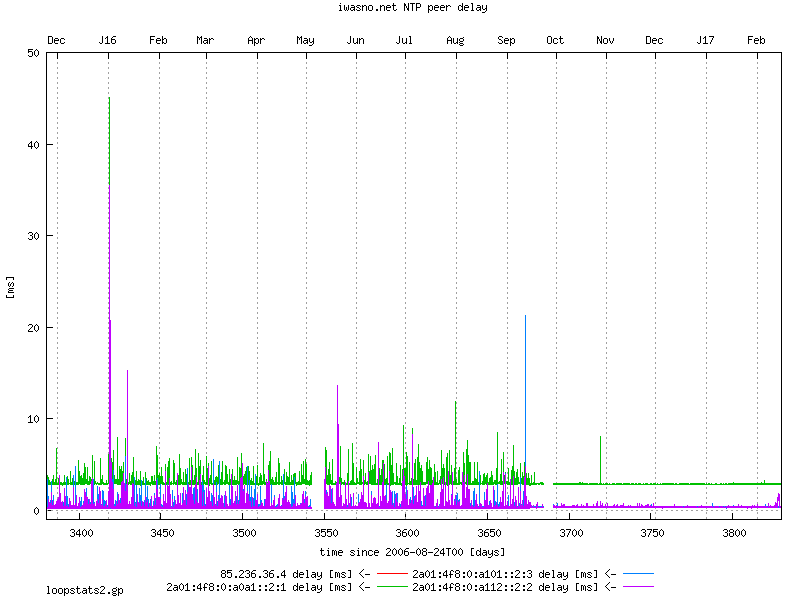
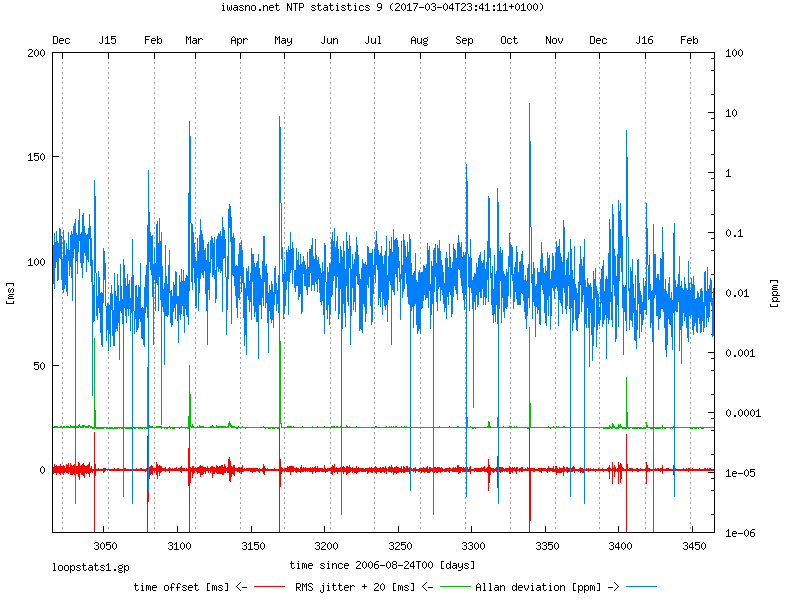
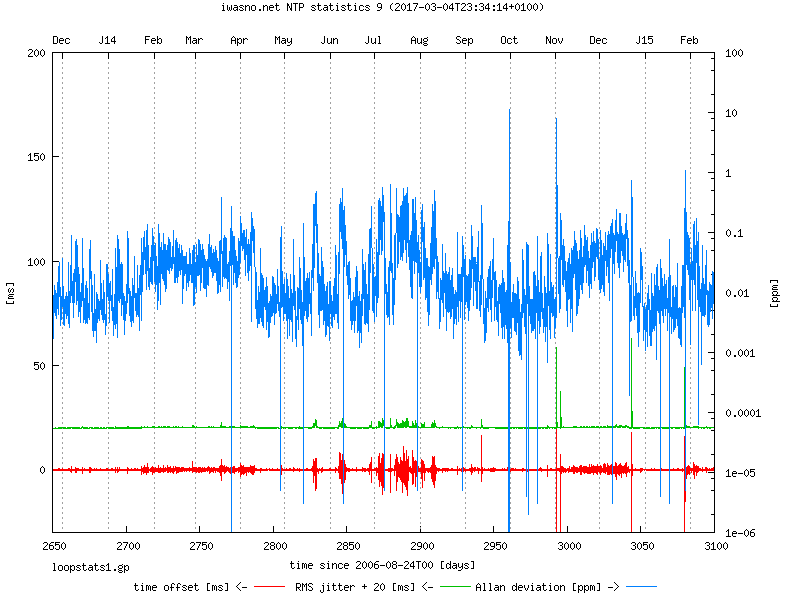
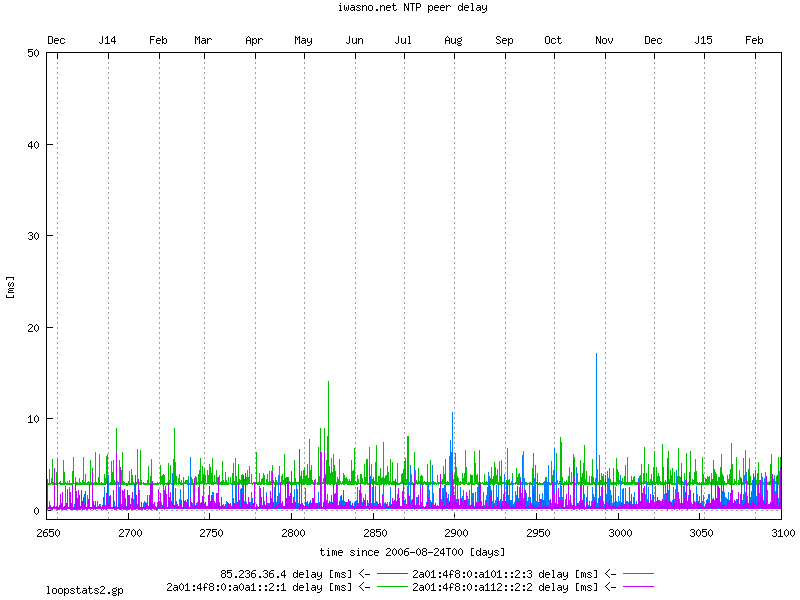
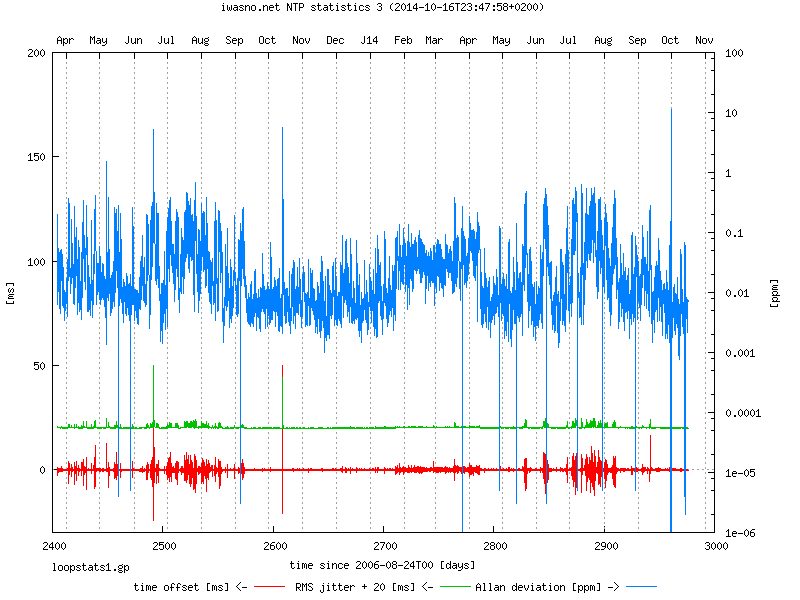
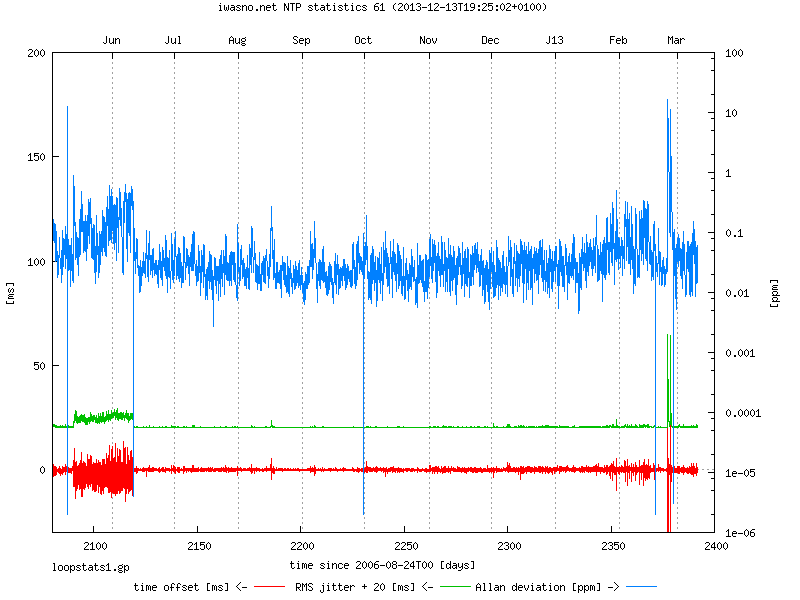
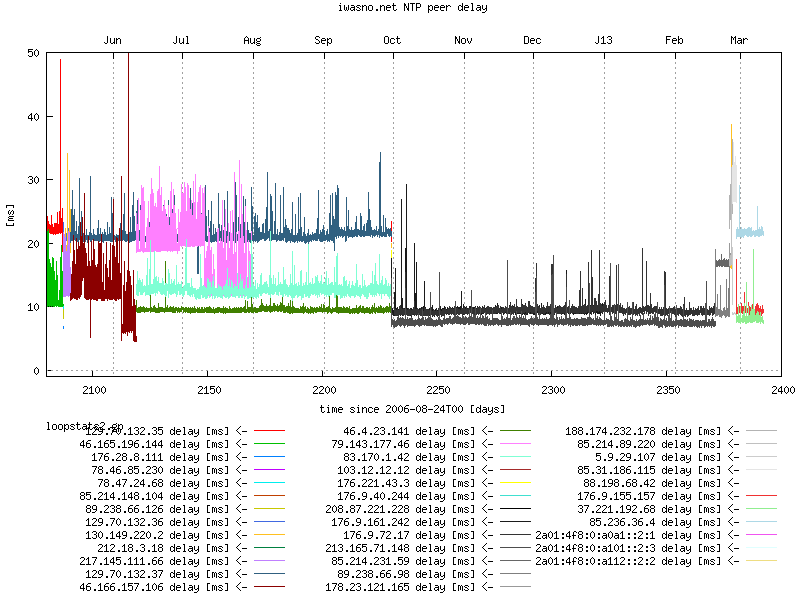
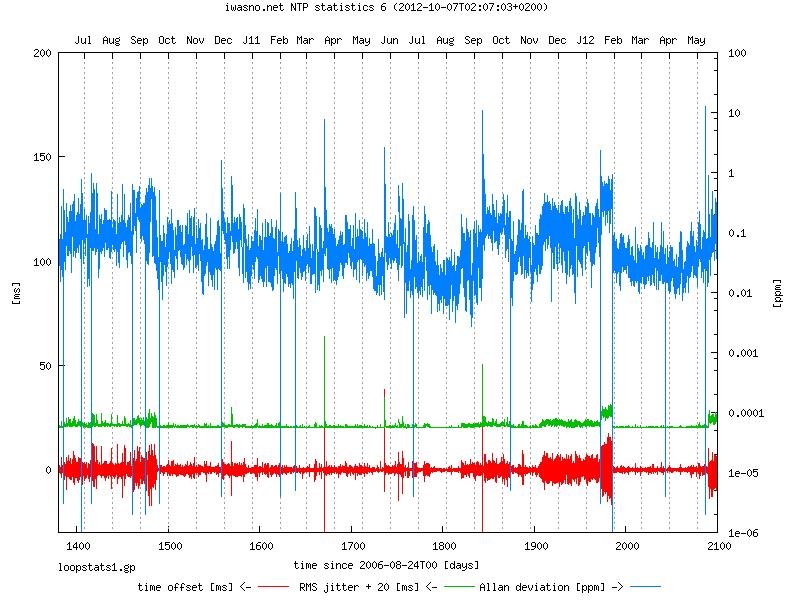
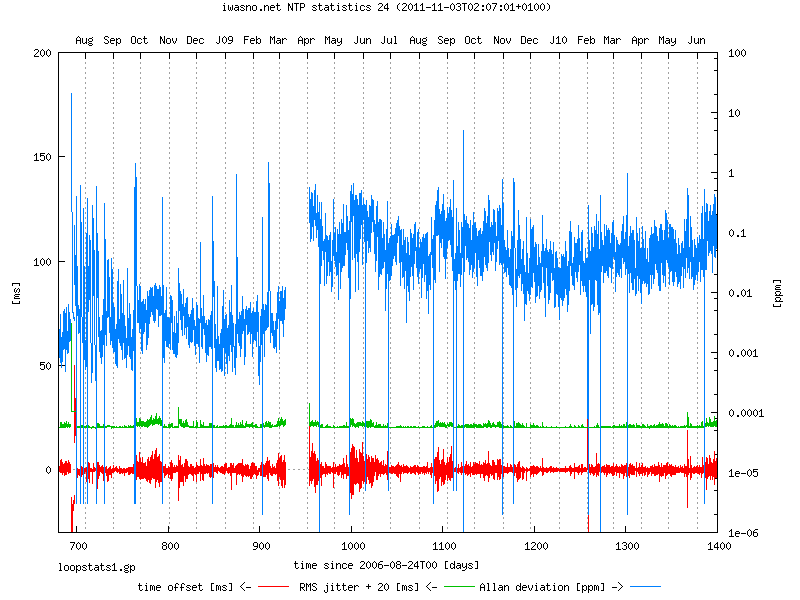
We have started to run the network time protocol daemon ntpd some time ago, here are the daily plots of the statistics. It seems that the time offset stays in the interval [-10 10] ms, but there are some disturbances which are probably due to congestion on the link between iwasno.net and the NTP peer.

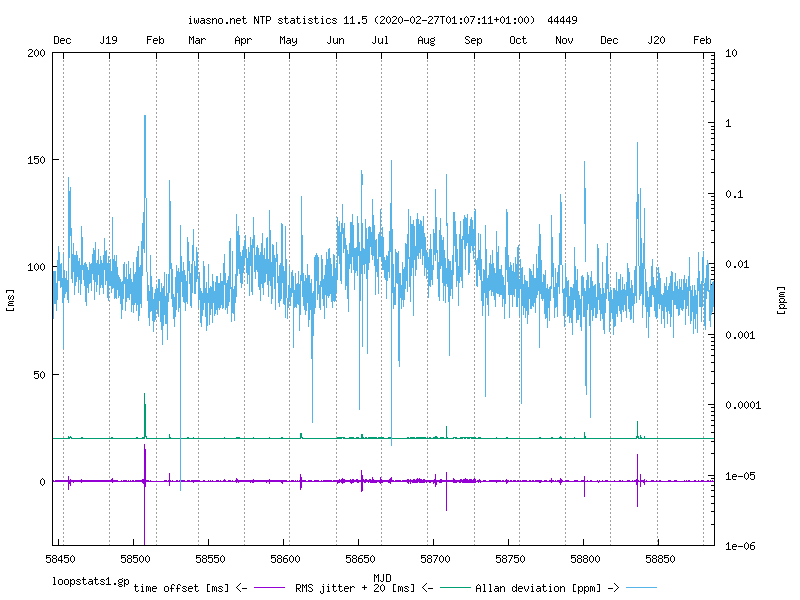
Additional plots can be found on the new NTP page.

Most recent plots

PNG

The following plot has been created locally using a gnuplot with PNG support (hence the nicer text font, I also increased the size to 800x600). Note that delay, jitter and offset values outside [-50 150] ms are not plotted to reduce the overlap between the curves.

NTP loop and peer
statistics

NTP loop and peer
statistics

NTP frequency error and temperature

Current and previous servers 2006..early 2020

NTP loop and peer statistics

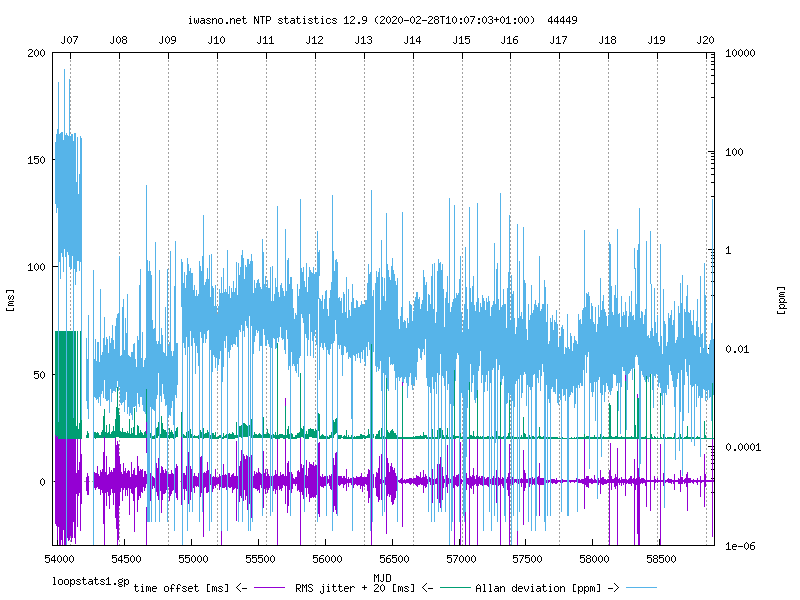
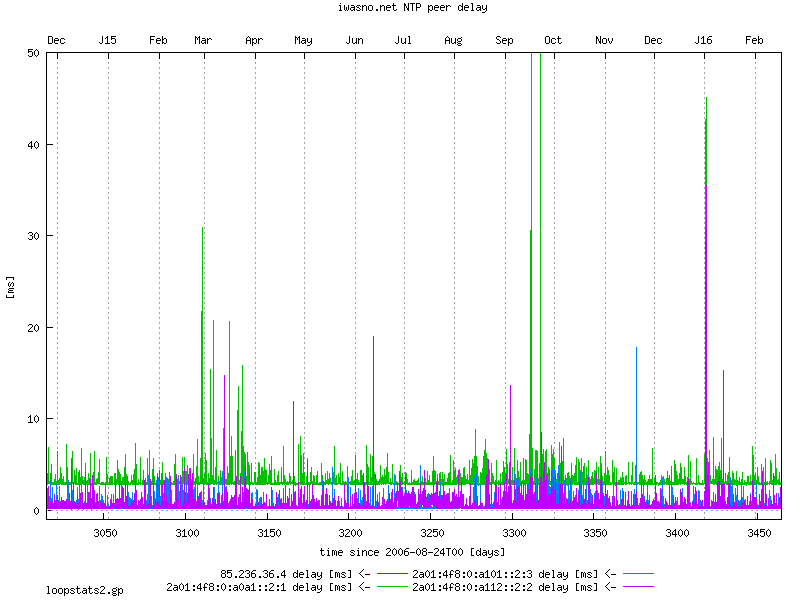
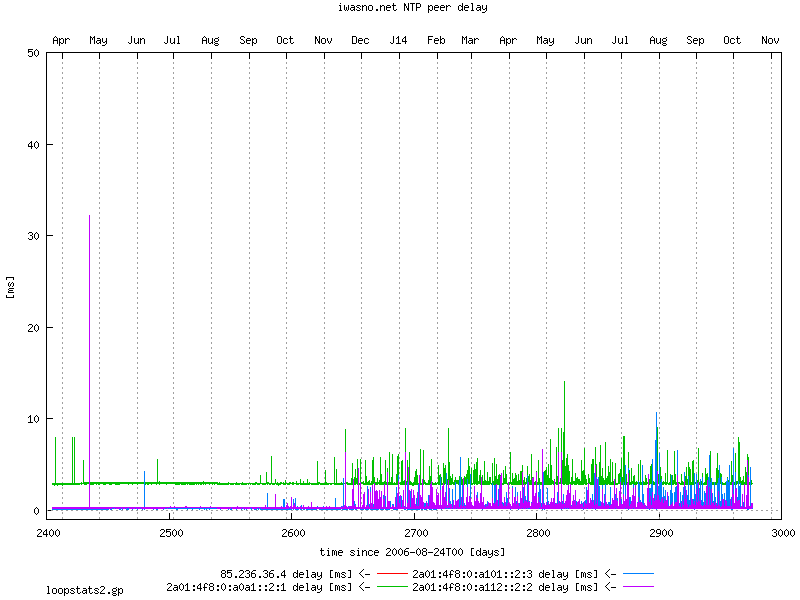
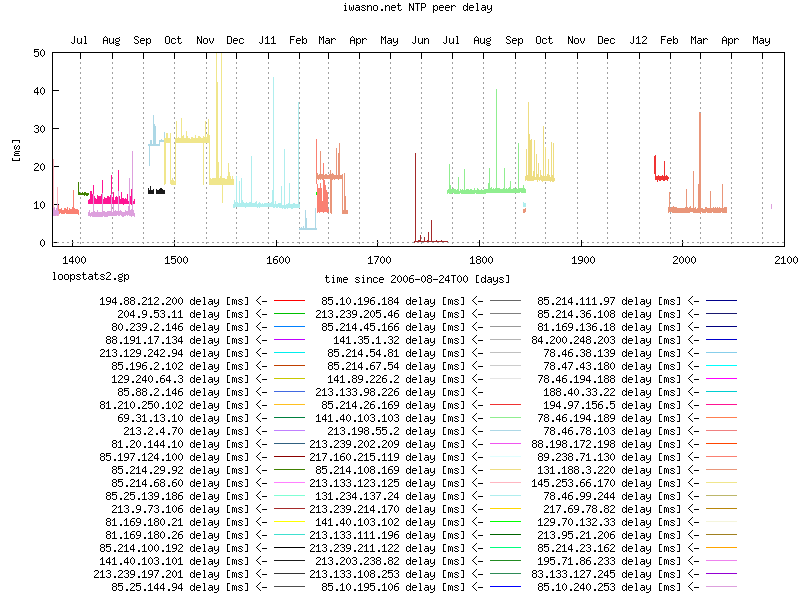
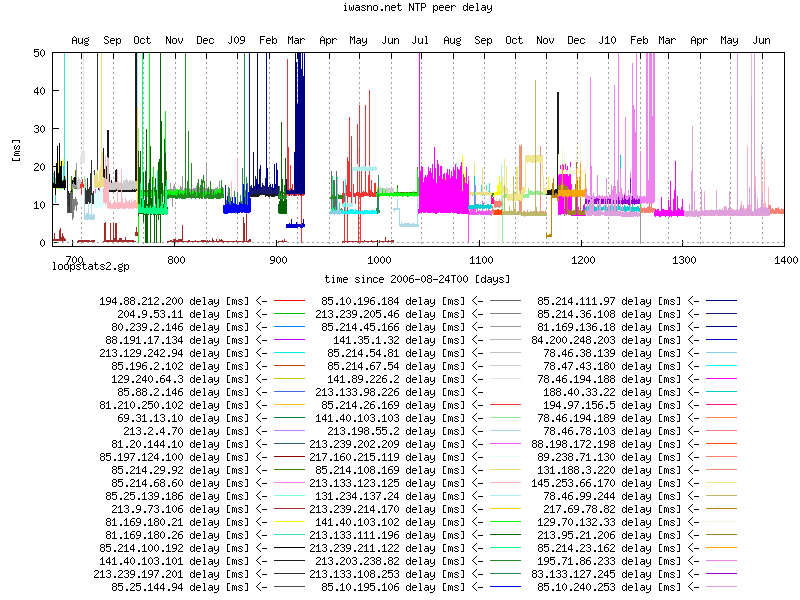
The NTP peers before 2013 have to be added to this plot.

NTP loop and peer statistics

NTP frequency error and temperature

HTML5 canvas

The plots produced by gnuplot with the HTML5 canvas device could be seen here (they require Javascript).

Current server (tux4), 2019

NTP loop and peer statistics

NTP loop and peer statistics

NTP frequency error and temperature

Current server (tux4), 2018

NTP loop and peer statistics

NTP loop and peer statistics

NTP frequency error and temperature

Current server (tux4), 2017

NTP loop and peer statistics

NTP loop and peer statistics

NTP frequency error and temperature

Current server (tux4), 2016

NTP loop statistics: offset, jitter and Allan deviation

NTP peer statistics: peer delay

NTP frequency error and temperature

Current server (tux4), 2015

NTP loop statistics: offset, jitter and Allan deviation

NTP peer statistics: peer delay

NTP frequency error and temperature

Current server (tux4), 2014

NTP loop statistics: offset, jitter and Allan deviation

NTP peer statistics: peer delay

NTP frequency error and temperature

Current server (tux4)

NTP loop statistics: offset, jitter and Allan deviation

NTP peer statistics: peer delay

NTP frequency error and temperature

Previous server (box74114)

NTP loop statistics: offset, jitter and Allan deviation

NTP peer statistics: peer delay

NTP frequency error and temperature

Older plots

NTP loop statistics: offset, jitter and Allan deviation

NTP peer statistics: peer delay

NTP frequency error and temperature

Even older plots

NTP loop and peer statistics

NTP loop and peer statistics

NTP frequency error and temperature

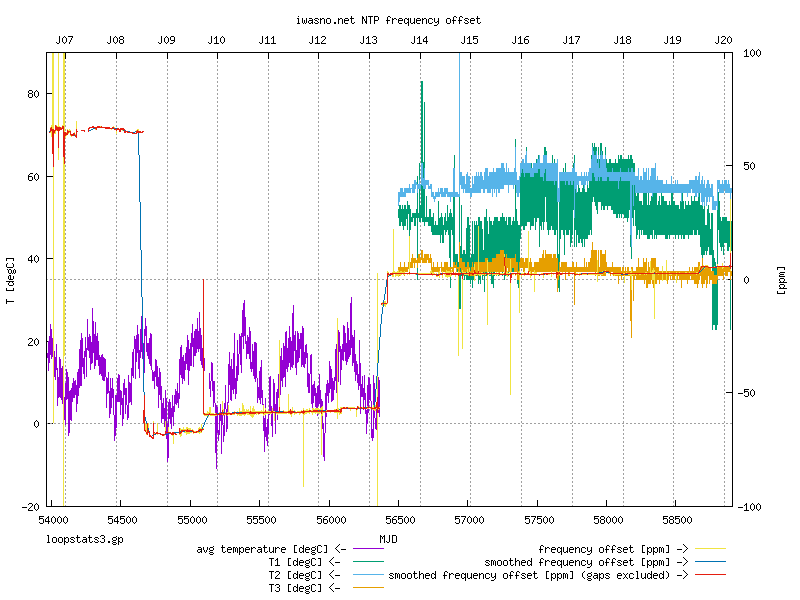
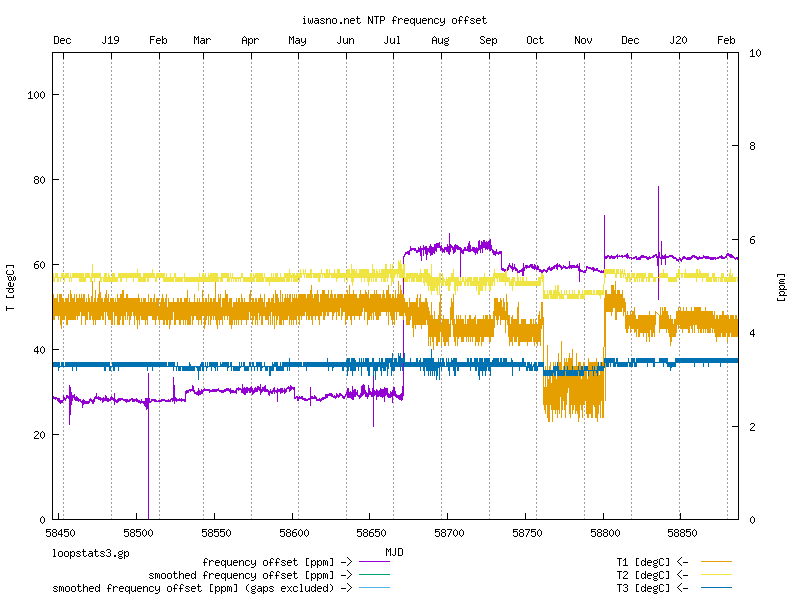
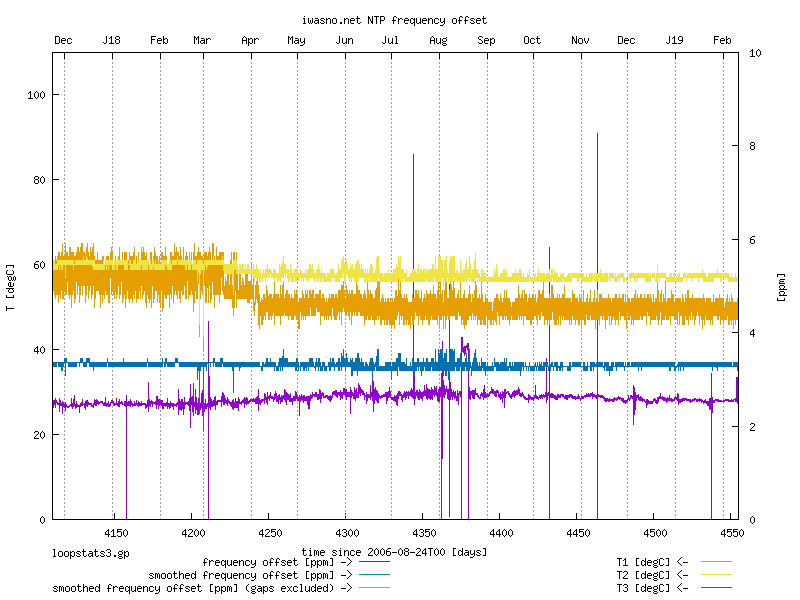
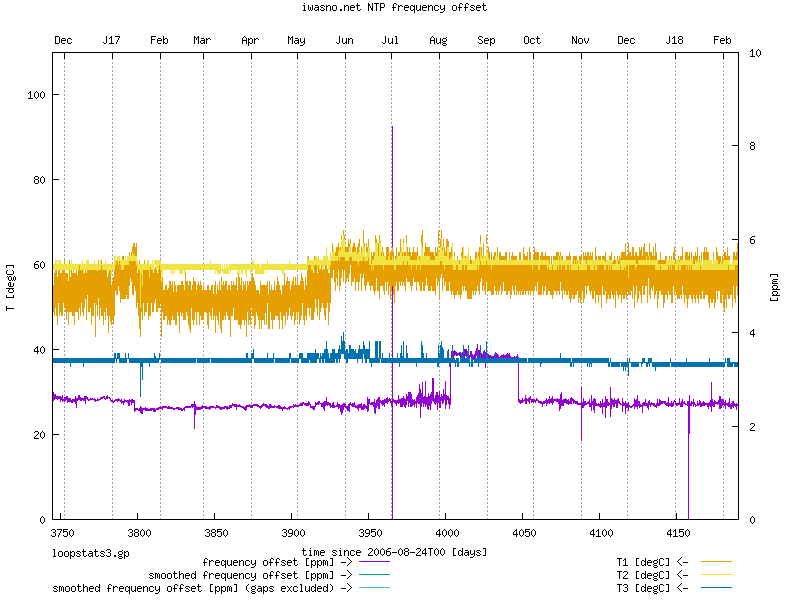
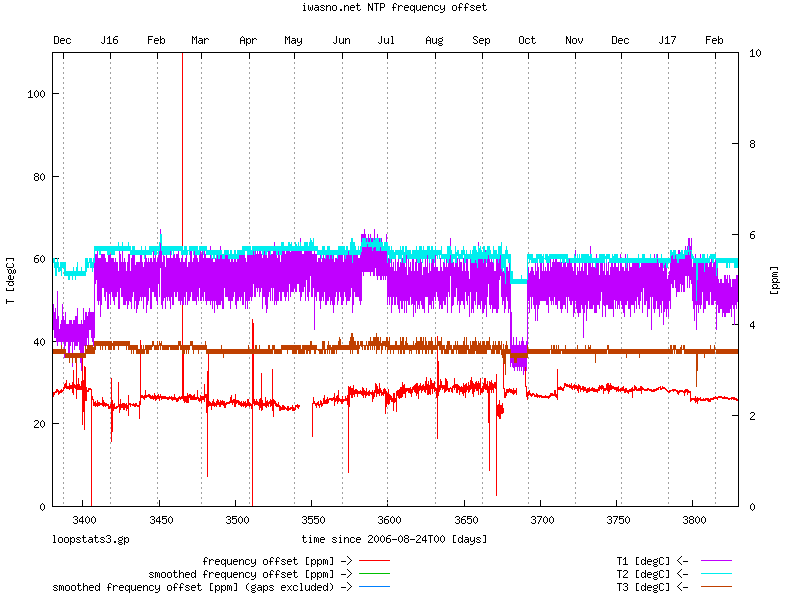
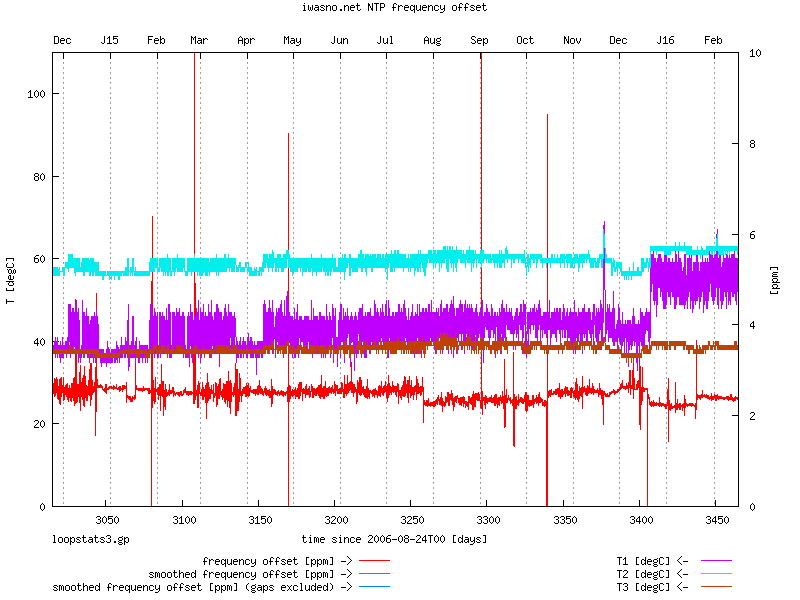
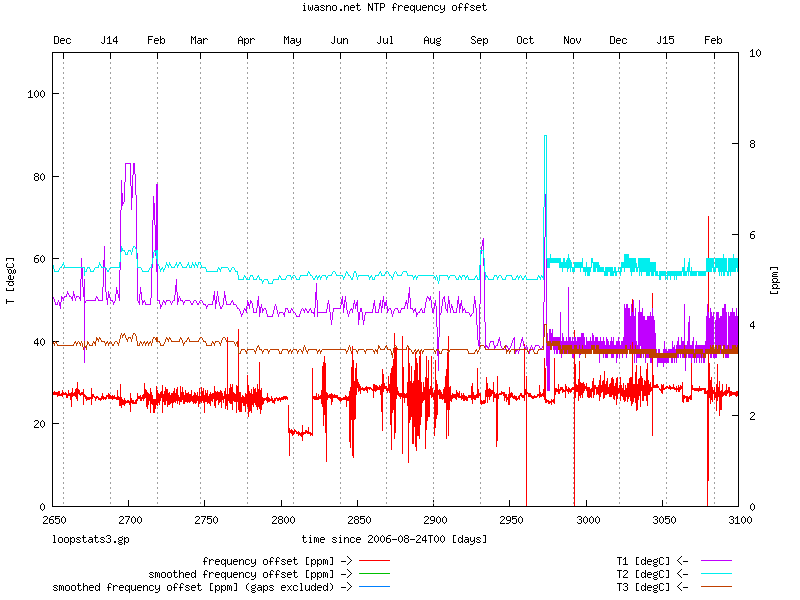
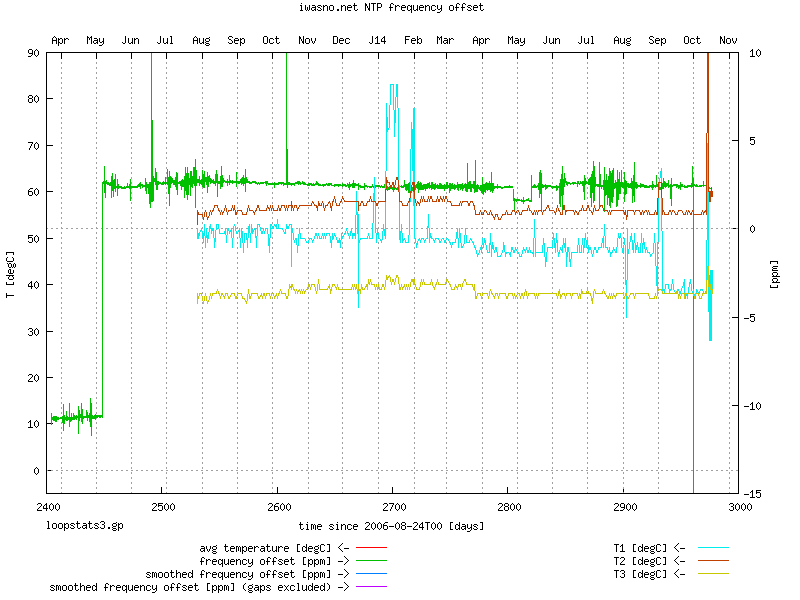
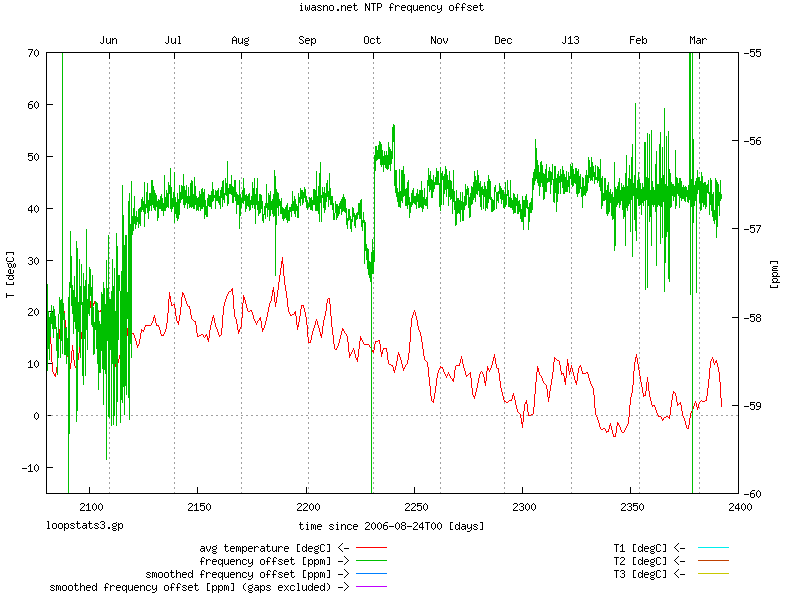
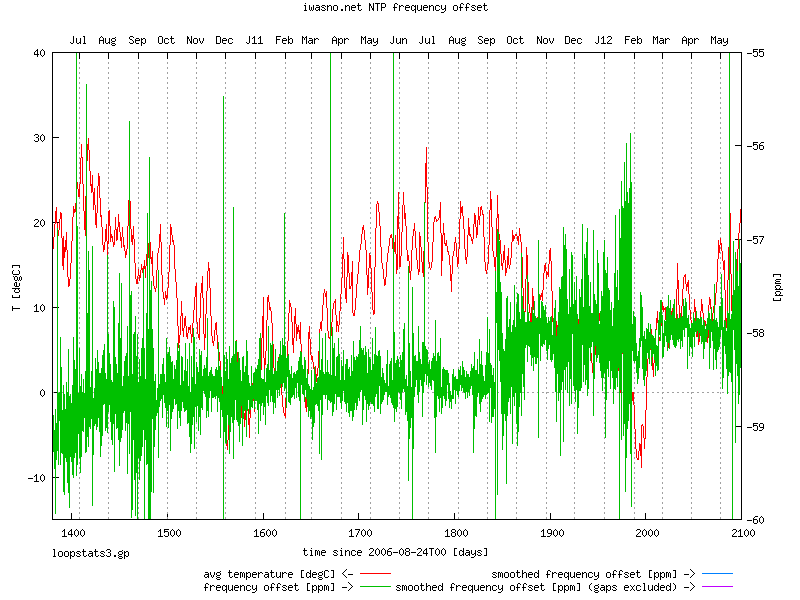
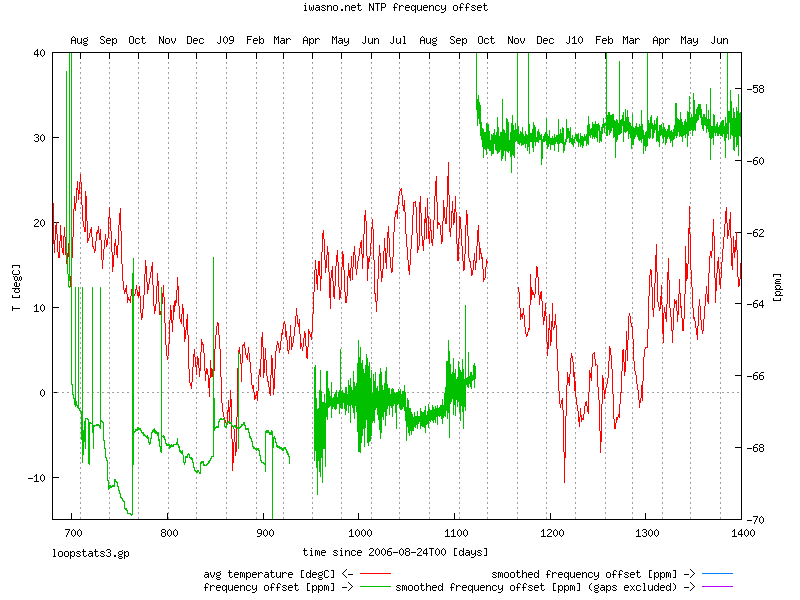
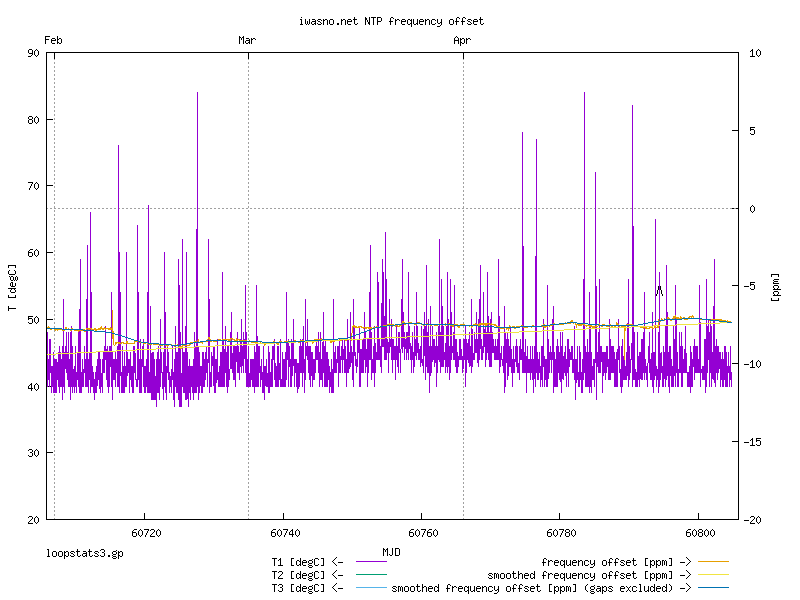
The following plot shows the frequency offset of the old server (box7842).

There seems to some correlation between frequency error and temperature although it is not as strong as in this example.

NTP frequency error and temperature

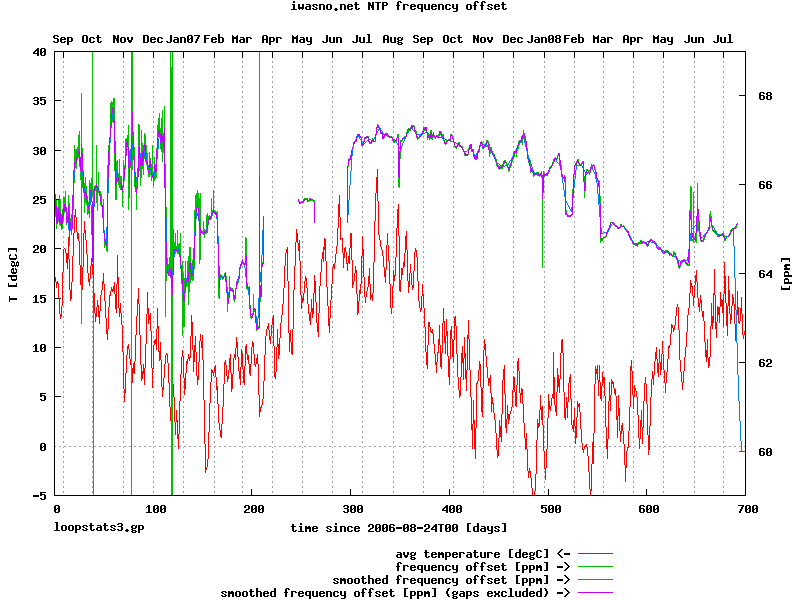
Temperature data courtesy of the University of Duisburg-Essen ALBERT-KRATZER-KLIMASTATION (Stadtstation) refers to outside, whereas the machine is in a temperature-controlled data center.

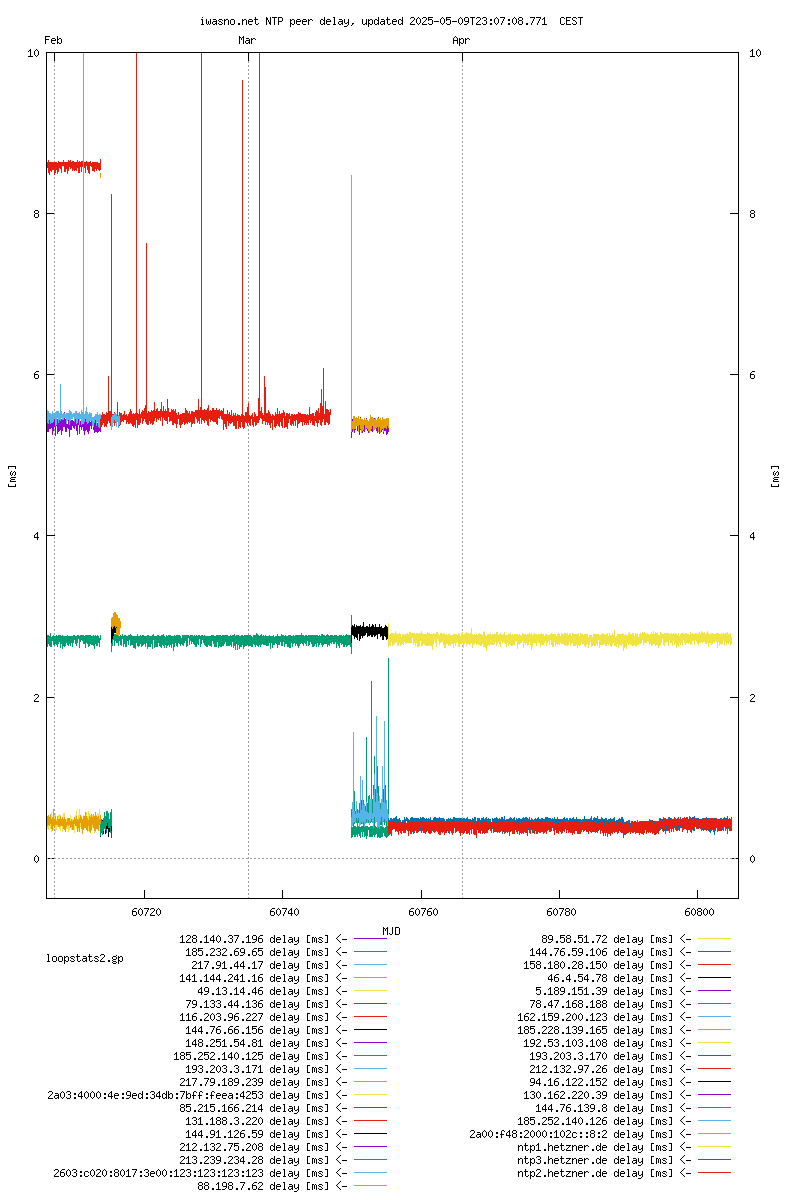
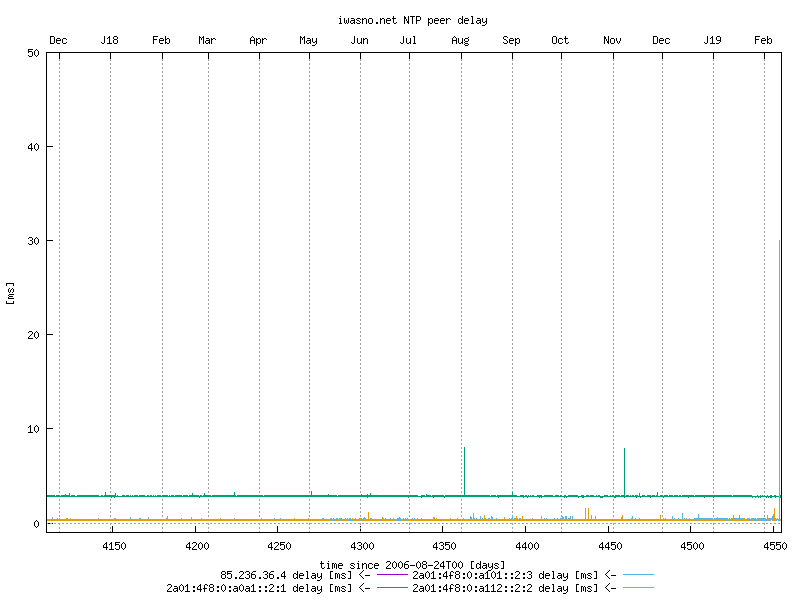
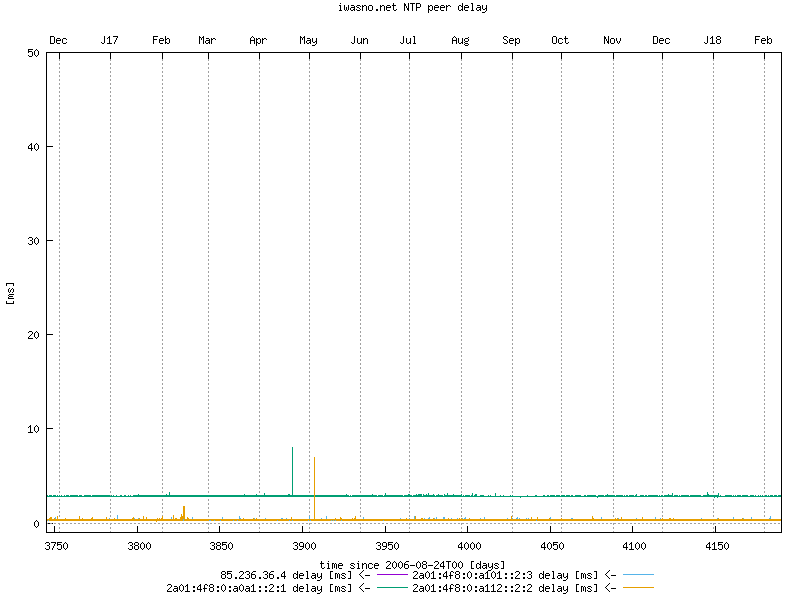
The NTP peer changed often (usually after each reboot), this can be clearly seen as a jump in the delay and a change in the noise on the time offset, frequency offset curves.

Some information about peers used in the first few months can be found on the NTP peers page.

Last changed: 2023-02-11T14:01:27-CET.

Valid HTML 5! Valid CSS! back to Roland's start page.